The problem
Equipment service and operations teams can only react to what they can see. Machines out in the field produce logs, sensor readings and camera images, but the data stays on the machine. A problem is usually found when a customer calls, not when it starts.
What I built
A complete monitoring system, from the device to the dashboard.
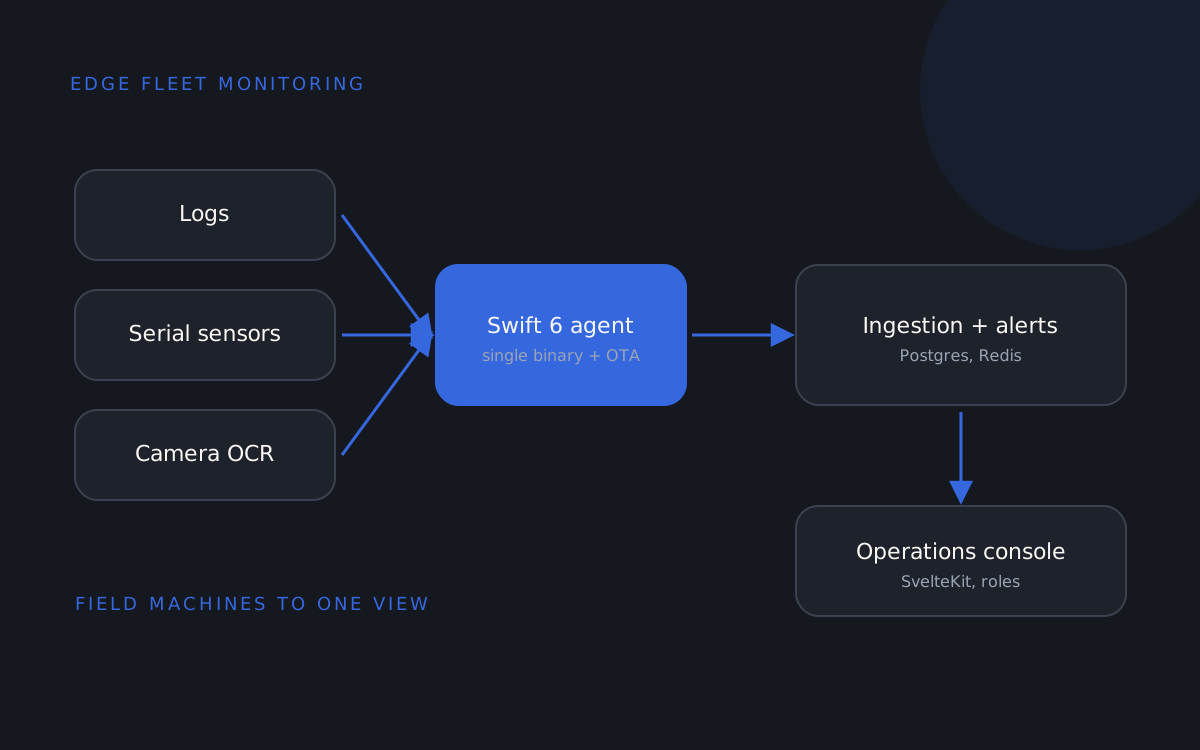
On the machine. One Swift 6 program, shipped as a single binary, runs on each field device. It collects log files, reads serial sensors, and uses optical character recognition on camera images to read values off displays that were never meant to be connected. It can be updated over the air, so a fix reaches the whole fleet without a site visit.
In the middle. A central ingestion service receives the data, stores it in Postgres, and uses Redis for fast state. It raises alerts when readings or devices need attention.
For people. A SvelteKit operations console gives staff one view of:
- customers and their sites
- every device and its network state
- live alerts and history
- reports
Access is role-based, so each person sees only what their role allows. The interface sits on a custom design system built around Liquid Glass, with consistent components across every screen.
Stack
- Swift 6 for the device agent, with over-the-air updates
- Postgres and Redis for ingestion, state and alerting
- SvelteKit for the console
- A custom Liquid Glass design system
Outcome
The business can see its whole installed base in one place, find problems from the data instead of a phone call, and update devices remotely. Data that used to be trapped on individual machines, including readings from equipment with no digital output, now arrives in one system where it can be searched, alerted on and reported.